Growth came back.
Norway didn't.
Last quarter I wrote that value beat growth in every region, and that Norway, up 27% in Canadian dollars, was the single best market in the world. Nobody saw it coming.
Q2 reversed a good part of that. Growth came back in most of the world, Norway gave back its lead and finished the quarter negative, and every diversified portfolio still had a strong three months.
Here's what happened, what it means, and what to watch next.
Markets, in one table
| Returns | CA | US | Dev exNA | EM | REITs | CA bd | Gl bd |
|---|---|---|---|---|---|---|---|
| Q2 | 6.96% | 17.26% | 12.40% | 24.74% | 12.61% | 1.94% | 0.91% |
| YTD | 11.16% | 14.56% | 13.01% | 26.70% | 15.53% | 2.13% | 0.32% |
| 1 year | 32.87% | 27.25% | 24.59% | 45.88% | 19.98% | 3.36% | 1.41% |
Broad market index returns, shown for context. Past performance is no guarantee of future results. Indices are not available for direct investment. Index performance does not reflect the expenses associated with the management of an actual portfolio.
This was a good quarter to own equities almost everywhere, and a better one to own them broadly. Emerging markets led at 24.74% in Canadian dollars, more than triple Canada's 6.96%, with the US, REITs and international developed all clustered in the low-to-mid teens. Bonds stayed positive but quiet, which is what they are meant to do.
Stretch the lens to a full year and the numbers get larger. Emerging markets are up 45.88%, Canadian stocks 32.87%, US stocks 27.25% and international developed 24.59% over the twelve months to June 30.
This quarter's best and worst
| Top 5 | Return | Bottom 5 | Return |
|---|---|---|---|
| Korea | +80% | Hong Kong | −5% |
| Taiwan | +51% | China | −7% |
| Netherlands | +37% | Brazil | −9% |
| Hungary | +35% | Norway | −12% |
| Egypt | +28% | Indonesia | −33% |
Country returns, Q2 2026. Past performance is no guarantee of future results. Source: Dimensional Fund Advisors Canada ULC, MSCI data © 2026, all rights reserved.
Last quarter's hero, this quarter's laggard
In Q1, Norway was the best-performing developed market in the world, up 27% in Canadian dollars on the back of surging energy stocks and a strong currency. I wrote at the time that no strategist had it on their radar at the start of the year.
This quarter Norway finished negative. Korea took the top spot instead, up roughly 80% in Canadian dollars over the quarter, with Taiwan, the Netherlands and Hungary close behind.
Same countries, completely different order, one quarter apart. Nobody predicted either ranking. We own all of them so we never have to.
Our model portfolios this quarter
| Returns | Q2 | YTD | 1 yr |
|---|---|---|---|
| 100% equity | +11.08% | +14.68% | +31.21% |
| 80/20 growth | +9.10% | +11.92% | +25.07% |
| 60/40 balanced | +7.12% | +9.24% | +19.24% |
| 40/60 conservative | +5.29% | +6.64% | +13.71% |
The portfolio returns shown are those of the globally diversified Series F funds from Dimensional Fund Advisors used for each allocation, net of the funds’ management fees and operating expenses and before the advisory fee charged on a managed account, which would reduce them; see the fee schedule. They are not the return of any individual client account; a client’s own return will differ with when they invested, contributions, withdrawals, the advisory fee, and any other funds held. As of June 30, 2026. The three-month, year-to-date and one-year periods shown are not standardized performance periods; standardized returns are available on request. Past performance is not indicative of, and does not guarantee, future results.
The DFA Canada Global Equity Portfolio, the equity engine inside these models, returned 11.08% for Q2 and is up 31.21% over the past year. Even the most conservative 40/60 mix cleared 5% in a single quarter.
Growth and large caps had the edge
| Size | Value | Growth | High prof. | Low prof. |
|---|---|---|---|---|
| Large | 14.2% | 17.7% | 15.3% | 17.0% |
| Small | 15.8% | 15.1% | 13.8% | 17.1% |
Global factor performance. Past performance is no guarantee of future results. Source: Dimensional Fund Advisors Canada ULC, data as of June 30, 2026.
Small caps underperformed large caps. Value underperformed growth within large caps, and outperformed within small caps.
Leadership rotated again
The clearest story this quarter is rotation. In Q1, value beat growth in all four regions at the same time. In Q2 that reversed almost everywhere. Growth outperformed value in the US, international developed and emerging markets. Canada was the lone exception, where value kept its lead by a wide margin.
Small companies lagged larger ones in every region this quarter, roughly the opposite of what parts of Q1 delivered.
Chase recent winners and you're always one quarter late. That's exactly why the portfolio holds all of it at once, rather than betting on the last leaderboard.
Bonds did their job quietly
Canada · nominal yield curve
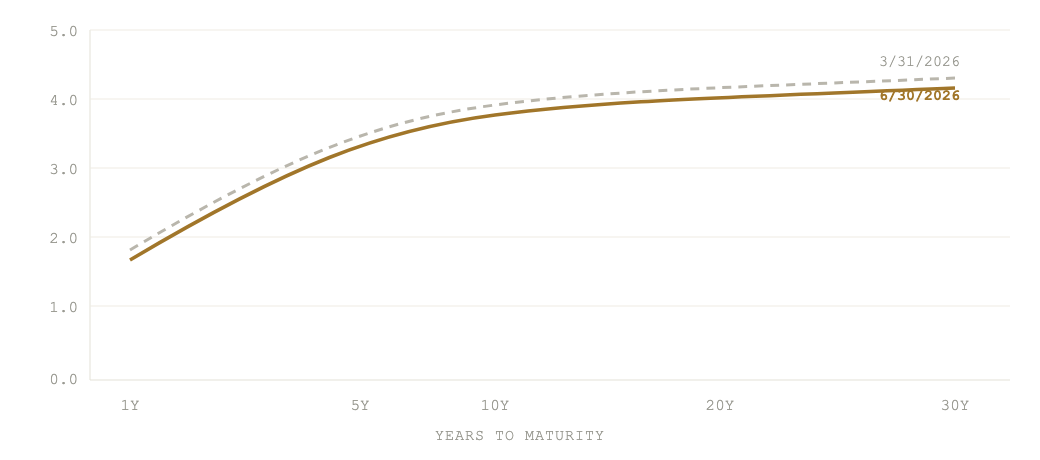
Canadian government bond yields fell across the curve this quarter, with the 10-year down about 10 basis points. Falling yields lift bond prices, which is part of why Canadian bonds returned 1.94%. Credit spreads stayed narrow, near 70 basis points on the global credit index. The Canadian yield curve stayed upwardly sloped, so longer bonds still offer more yield than short ones.
Abroad, the picture was mixed. US short-term yields rose sharply, German yields fell and Japanese long-term yields climbed. That divergence is precisely why our fixed income exposure is global and currency-hedged rather than concentrated at home.
None of this is dramatic, and that is the point. Bonds are there for stability and income, not to keep pace with equities. A common mistake I see with new clients is holding more cash or GICs than their goals call for. The right mix depends on your own timeline and circumstances.
Why we're not guessing
Q2 is another clean example of evidence-based investing in practice. Value led one quarter and trailed the next. Norway topped the world, then gave it back. Emerging markets, quiet for years, ran ahead of everyone. None of it was forecast, by us or by anyone.
The portfolio isn't built on predictions. It's built on factors: value, size and profitability, persistent drivers of return documented across more than a century of data, implemented systematically by Dimensional Fund Advisors since 1981. One quarter proves nothing. A hundred years of data is the case.
What that structure buys you is freedom from having to be right about next quarter. Your portfolio is designed to capture returns wherever they show up, keep costs low and stay disciplined while the headlines churn.
Curious how your own financial plan stacks up?
Most incorporated business owners I meet are leaking money in one of three places without knowing it: how the corporation is structured for tax, what they are quietly paying in investment costs, or a retirement and exit plan that was never actually built. If you want a straight read on where you stand, book a time and we'll talk it through. No pitch, no obligation.
Book an intro call Subscribe to the newsletterGuillaume
Guillaume Girard, CFA, CFP®
Founder & Financial Planner
Girard Wealth · Victoria, BC
Main Line: 226-241-4559
Portfolio Strategies Corporation
This material is for informational purposes only and does not constitute an offer to sell or a solicitation to buy any mutual funds, nor does it constitute investment, tax or legal advice. Please consider your risk tolerance and financial situation before investing.
Performance. All performance figures are historical and cover the periods and as-at date shown above. The portfolio returns shown are those of the globally diversified Series F funds from Dimensional Fund Advisors that form the core of what is recommended, net of the funds’ management fees and operating expenses and before the advisory fee charged on a managed account, which would reduce them. They are not the returns of any individual client account: a client’s own return will differ with when they invested, contributions and withdrawals, the advisory fee, and any other funds they hold. The periods shown are not standardized performance periods; standardized returns are available on request. Index, factor and country returns are unmanaged, shown for context only, not available for direct investment, and do not reflect any fees or expenses. Past performance is not indicative of, and does not guarantee, future results; investment values can fall as well as rise. Sources: Dimensional Fund Advisors Canada ULC and fund company reporting.
Girard Wealth is a trade name of Guillaume Girard. Mutual funds are offered through Portfolio Strategies Corporation, a member of CIRO. Insurance through PPI.
Commissions, trailing commissions, management fees, and expenses all may be associated with mutual fund investments. Please read the prospectus before investing. Mutual funds are not guaranteed and their values change frequently and past performance may not be repeated.
Important information on mutual funds is found in the simplified prospectus. To obtain a copy, contact your Advisor.